Science project
Which Side of the Brain Draws the Best?

Difficulty of Project
Easy
Cost
$5 or less
Safety Issues
None
Material Availability
Free materials are available to be reproduced on the internet. Writing on the Right Side of Your Brain by Dr. Betty Edwards is an excellent resource and is available at any public library.
Approximate Time Required to Complete the Project
One to two weeks. This includes collection, recording and analysis of data, summary of results and completion of bibliography.
Objectives
To design and conduct an experiment to determine whether drawing with the right or with the left side of your brain will produce a “better” picture. Better is defined as a picture with more accurate detail which more closely resembles the original as determined by a comparison with the right and the left brain products.
Materials and Equipment Required
- Drawing paper
- Number 2 pencils
- Two sketches from which to make copies
- Five to ten participants of approximately the same age and gender
Introduction
Background Information
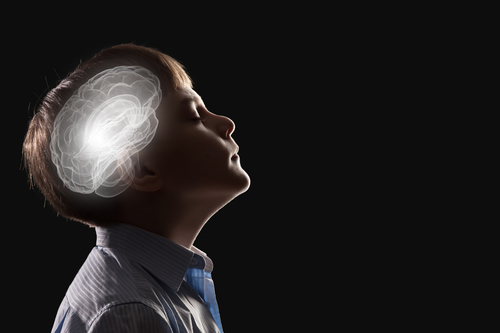
On the information level, this experiment serves to acquaint students with current information in the neurosciences on the specific functions of the right and left hemispheres of our brain. Recent data substantiates that the left brain is the verbal brain, labeling and naming objects while the right brain focuses on space relationships, assessing spatial relationships, line and angle formations as well as what is viewed as positive and negative space. Based on this information, when we are engaged in drawing or copying sketches, the approach taken will be determined by which hemisphere we choose to use. It we use the right; we will focus on spatial relationships, lines, curves and angles. If we choose the left hemisphere, we will be focusing on drawing objects, faces, noses as opposed to following lines, angles and outlining spaces. This is the crux of this experiment. The question is whether the use of the right or the left brain will produce the better product, one more detailed and a better replica of the original drawing.
On the level of the process of experimenting, this science fair project serves to acquaint students with the essential processes of sciencing such as the importance of clearly defining the problem to be explored, of stating the hypotheses and the rationale for the hypothesis, of demonstrating an understanding the use of a control, of identifying dependent and independent variables, of data collection, of pictorial and graphic presentation of data and of being able to make better judgments as to the validity and reliability of their findings. They take on the role of scientists and in the process they learn to act as one.
Research Terms
- Neuroscience
- Cerebral Cortex
- Right Brain
- Left Brain
- Split Brain
- Lateralization
- Cognition
- Affect
Research Questions
- What does research in the neurosciences tell us about the specific functions of the right and left brain hemispheres?
- What functions does each hemisphere serve?
- What is meant by the split brain phenomenon?
- What have we learned as a result of split brain surgery?
- How does research on hemispheric functions fit with drawing on the right or the left side of the brain?
- What contributions and applications of brain research has Dr. Betty Edwards made to the field of art?
Terms, Concepts and Questions to Start Background Research
- What is a control? A control is the variable that is not changed in the experiment.
- What purpose does a control serve? It is used to make comparisons as to what changed or possibly caused the change.
- What are variables? Variables are factors that can be changed in an experiment.
- What is an independent variable? The independent variable is the one that is changed in the experiment.
- What is a dependent variable? The dependent variable is the one that changes as a result of the change in the independent variable.
Charting and Graphing Data
In each section of the experiment, use this chart to display the obtained data from the analysis of the pictures produced by the right brain directions and the left brain directions. Summarize your findings and graph your results. Remember, a picture, in this case, the graph is worth a thousand words!
| Subject #'s 1-10 |
Amount of Detail Left Brain (H,M,L) |
Amount of Detail Right Brain (H,M,L) |
Resemblance to Original Left Brain (H,M,L) | Resemblance to Original Right Brain (H,M,L) |
Experimental Procedure
- State the problem you are going to investigate in this science fair project.
- State your hypothesis and your rationale for this hypothesis.
- Reproduce the data sheets you will use to record your observations.
- Reproduce the pictures the subjects will use.
- Make ten packets of drawing paper, picture to be copied, a twelve inch ruler and pencils for distribution.
- Select ten classmates of the same gender and age as subjects.
- Provide them with the following directions: your task is to copy the picture you have been given twice. Once, you will place the picture right side up and copy it. You have 15 minutes. Then, you will place the picture upside down, use a ruler to move it upward, copying each segment above the ruler and focus on the lines, the angles and the shapes of the empty spaces. Forget the names of the objects in the picture. Just focus on the space and lines and shapes and angles. You have 15 minutes.
- Collect both sets of papers. Using the chart above, record your data as you analyze each of the papers in terms of the following two criteria, the amount of detail in each picture as high , medium or low, using H, M,and L and the degree to which the copied pictures resemble the original, again using high, medium or low,H, M,and L. Summarize your findings.
- Prepare your report and include all of the following: a clear statement of the problem and your hypothesis, List the materials used. Describe the procedures used. Include all the data that were gathered. Include the chart and graphs. Formulate your conclusions. For dramatic value, you may include photos of the materials used or of your subjects in the process of conducting these investigations well as sample drawings. Include a bibliography of sources you used. You may wish to assess what you did and describe what you would do differently if you were to do this project again. Think about how you could expand this research as to gender and age as variables in this context.
Bibliography
- Schwartz, Tony (1995). What Really Matters: Searching for Wisdom in America. Bantam Books. pp. 164. ISBN 0553374923.
- Edwards, Betty. The New Drawing on the Right Side of the Brain. Penguin Putnam. ISBN 0874774241.
- http://en.wikipedia.org/wiki/Betty_Edwards
Education.com provides the Science Fair Project Ideas for informational purposes only. Education.com does not make any guarantee or representation regarding the Science Fair Project Ideas and is not responsible or liable for any loss or damage, directly or indirectly, caused by your use of such information. By accessing the Science Fair Project Ideas, you waive and renounce any claims against Education.com that arise thereof. In addition, your access to Education.com's website and Science Fair Project Ideas is covered by Education.com's Privacy Policy and site Terms of Use, which include limitations on Education.com's liability.
Warning is hereby given that not all Project Ideas are appropriate for all individuals or in all circumstances. Implementation of any Science Project Idea should be undertaken only in appropriate settings and with appropriate parental or other supervision. Reading and following the safety precautions of all materials used in a project is the sole responsibility of each individual. For further information, consult your state's handbook of Science Safety.
Related learning resources